rack-stats
Tournament analytics pipeline for the Florida Billiards Circuit
A Python data pipeline that generates synthetic billiards tournament data, stores it in SQLite, computes meaningful stats via SQL aggregations, and presents everything in an interactive Streamlit dashboard.
The Problem
Tournament data in billiards is typically tracked in spreadsheets with no analytics layer. Understanding venue performance, player trends, and game type distributions requires manual work.
The Solution
An ETL pipeline with domain-accurate synthetic data — real Florida venue names, realistic Fargo rating distributions, proper handicap vs open tournament separation — feeding an interactive dashboard.
Screenshots
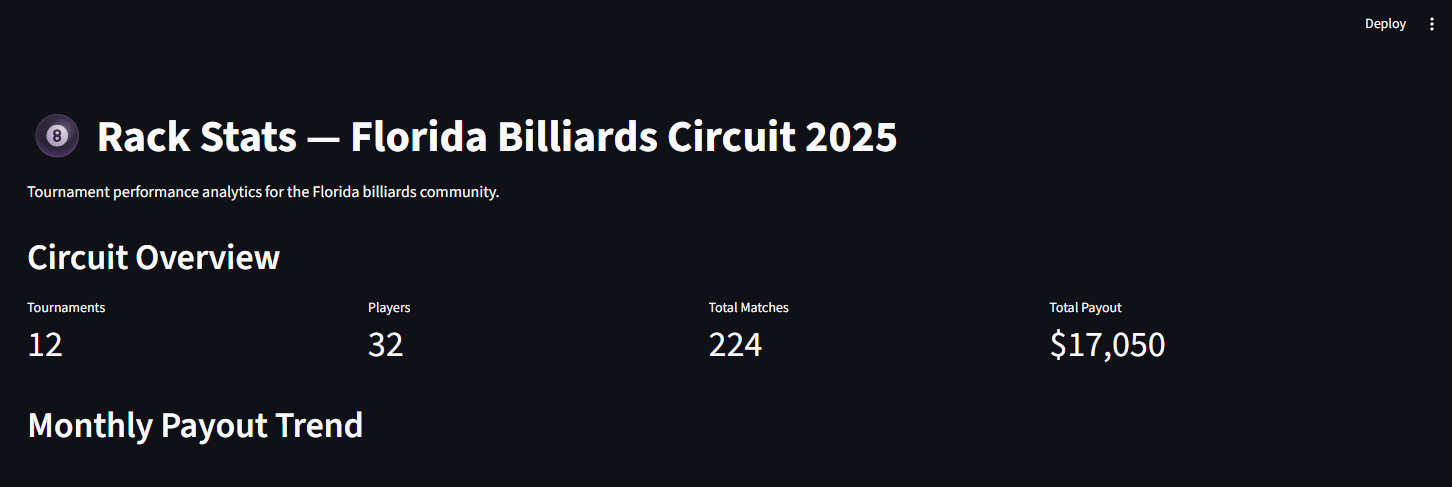
12 tournaments, 32 players, 224 matches, $17,050 total payout across the 2025 circuit
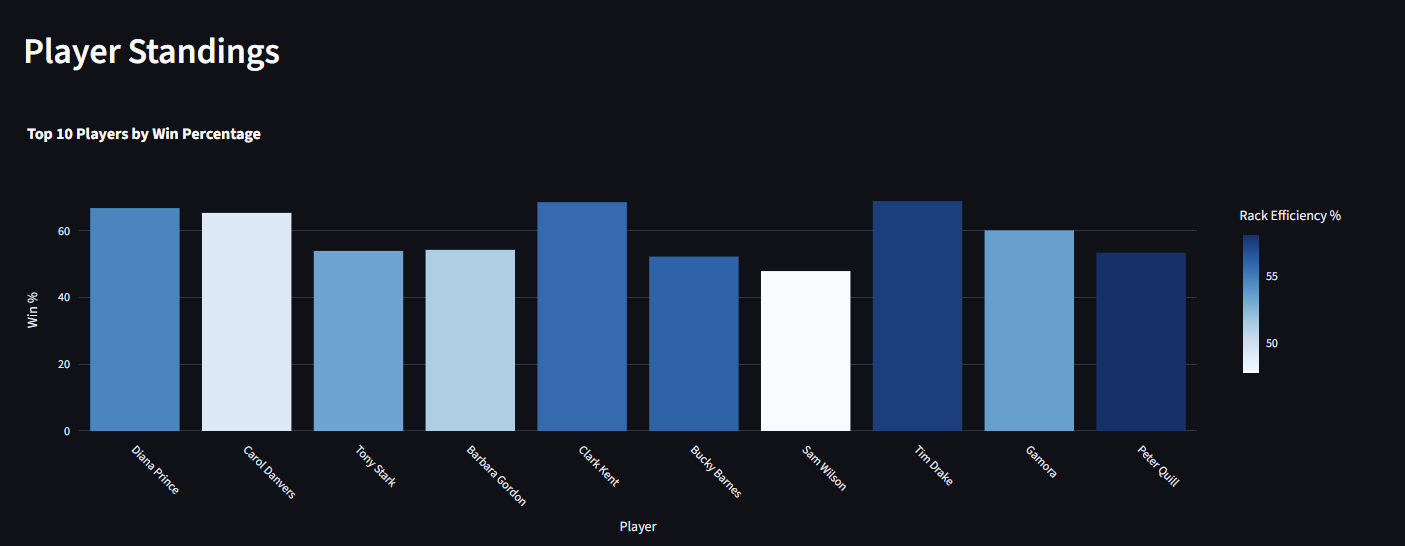
Top 10 players by win percentage with rack efficiency color coding — Marvel vs DC on the felt
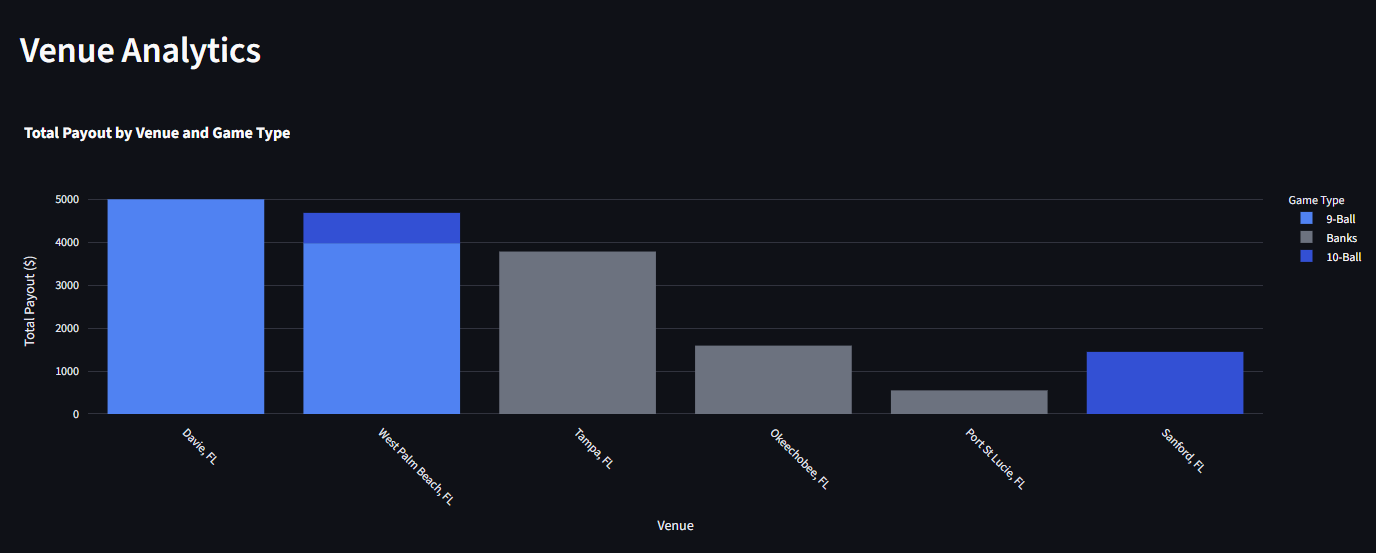
Total payout by venue and game type — Davie and West Palm Beach leading the circuit
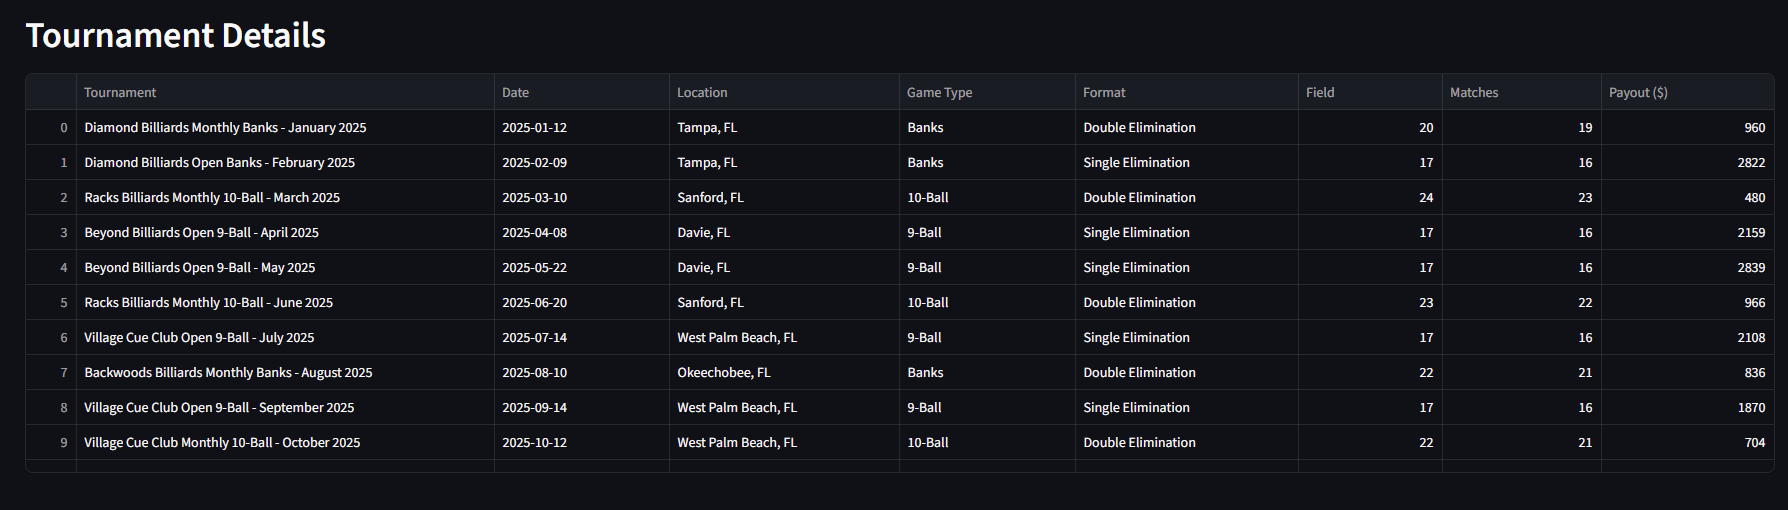
Full tournament details table with sortable columns
Tech Stack
Primary data engineering language
ORM for database modeling — same pattern as EF Core
DataFrame-based data manipulation and aggregation
Instant web dashboard from Python scripts
Interactive charts with hover and zoom
Zero-config database — anyone can run it locally
Key Engineering Decisions
Synthetic data uses real Florida venue names and accurate tournament formats
Handicap tournaments ($20-50 entry, Fargo ≤650) vs open tournaments ($100-200, any Fargo) modeled separately
Race lengths domain-accurate: Race to 7 for 9/10-ball, Race to 3 or 5 for Banks
Field size weighted toward 22-24 players to match real local tournament averages
W/L computed from match results rather than stored — caught 2 real query bugs during testing